Previous lesson: pandas Series
pandas DataFrame
A DataFrame is the workhorse data object in pandas. In this lesson we will learn about the basic characteristics of DataFrames, how to load them from files, and how to perform basic manipulations of them.
Learning objectives At the end of this lesson, the learner will:
- select a column by specifying its label.
- select a row by label index using the
.loc()method. - select a row by integer position using the
.iloc()method. - load an Excel or CSV file into a DataFrame using the one of the read methods.
- save a DataFrame as an Excel or CSV file using one of the write methods.
- display the first or last several lines of a DataFrame.
- state the name of the missing data indicator in pandas and list two situations where they are generated.
- create row index labels from a generic column containing text strings using the
.set_index()method. - perform a vectorized calculation to create a new table column.
- sort DataFrame rows using the
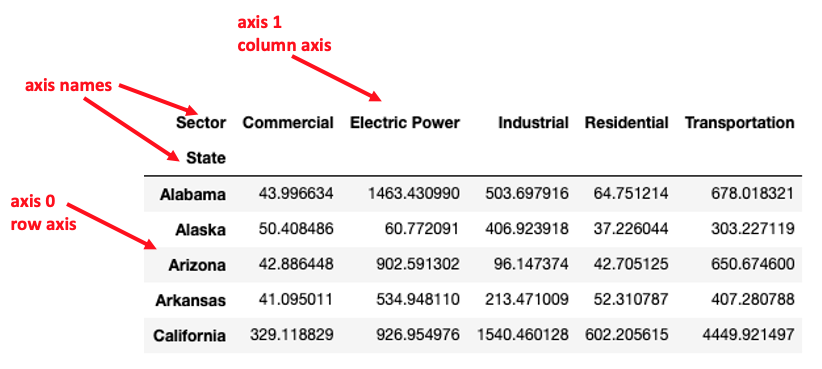
.sort_values()method. - define axis and associate the two pandas DataFrame axes with rows and columns.
- remove rows or columns using the
.drop()method. - concatenate the rows of two DataFrames having the same column headers.
- join two DataFrames using the
.merge()method. - describe the difference between an inner and outer merge.
Total video time: 55m 44s for all of the videos, but you don’t need to watch the videos for file systems you don’t use. So the actual total is probably closer to 45 minutes.
Links
Lesson Jupyter notebook at GitHub
DataFrames
Introduction to DataFrames (0m55s)
pandas DataFrame structure (6m28s)
Columns of a data frame can be referred to by their label in two ways:
states_df['capital']
states_df.capital
The “dot notation” can only be used if the column label is a valid Python object name (i.e. can’t have spaces). The resulting object is a series whose values are the values in the column labeled by the row label indices.
Rows in a data frame can be referred to by either their index label (using .loc[]) or their integer position (using .iloc[]):
states_df.loc['AZ']
states_df.iloc[1]
The resulting object is a series whose values are the values in the row labeled by the column headers.
Cells in a data frame can be referred to by their row, column labels (using .loc[]):
states_df.loc['PA', 'population']
The resulting object has the type of the cell value.
Loading a DataFrame from a file
All users should watch the two videos. The remaining videos in this section demonstrate how to load files from three different file systems. Select the one(s) that applies to your situation if you want to load files directly from your file system.
Loading a spreadsheet via a URL (3m02s)
Functions for reading and writing from spreadsheets to pandas DataFrames:
pd.read_csv() read from a CSV file into a data frame.
pd.to_csv() write from a data frame to a CSV file.
pd.read_excel() read from an Excel file into a data frame.
pd.to_excel() write from a data frame to an Excel file.
For details about reading from particular sheets in an Excel file, delimiters other than commas, etc. see the pandas User Guide and this Stack Overflow post.
Note: when loading files via a URL, be sure that the URL delivers the raw file, not an HTML representation of the file.
Examining the DataFrame
Use the .head() method to view only the first few lines of a DataFrame (default is 5 if number_of_lines argument omitted):
dataframe.head(number_of_lines)
The .tail() method is similar, but shows the last few lines of a DataFrame
The .shape attribute returns a tuple of the number of rows and number of columns.
The .columns attribute returns the column names as a pandas Index object. Use the list() function to convert into a simple Python list.
The .index returns the row label indices as a pandas Index object. Use the list() function to convert into a simple Python list.
Data types in DataFrames and missing values (4m39s)
pandas tries to guess the datatype of a column based on the values it contains. To force it to load all cells as strings, use the dtype=str argument:
schools_df = pd.read_csv(url, dtype=str)
NaN (“not a number”) is an NumPy object used by pandas to indicate missing data in a data frame. When data are loaded from a spreadsheet, by default empty cells are converted to NaN values.
To force pandas to read empty cells in as empty strings ('') rather than NaN, use an na_filter=False argument. This can be combined with a dtype=str argument to read everything in as strings (including empty strings):
schools_df = pd.read_csv(url, na_filter=False, dtype=str)
Loading a file from your file system
Variations on the following script are used in the next four videos to show how to load a spreadsheet from your local file system into a pandas DataFrame. The value of working_directory will be the directory from which the notebook was loaded. In the example, the data are in a subdirectory of the working directory called data.
import os
working_directory = os.getcwd()
print(working_directory)
filename = 'co2_state_2016_fuel.xlsx'
path = working_directory + '/data/' + filename
fuel_type = pd.read_excel(path)
print(fuel_type)
Loading into a local Jupyter notebook - Mac OS (4m54s)
Loading into a local Jupyter notebook - Windows OS (5m54s)
Loading a data file in Google Colab (5m08s)
Variation in mounting Google Drive (3m05s)
Setting the row label index of a DataFrame (3m09s)
The .set_index() method changes one of the columns into the row label index.
The .reset_index() method changes a row label index into a regular column.
Example:
state_co2_sector = state_co2_sector.set_index('State')
In the example above, the original DataFrame was replaced by the new one with the index set.
Manipulating DataFrames
Creating a calculated column (2m09s)
Examples:
# Create a new column whose values are the sum of two columns
schools_df['total'] = schools_df['Male'] + schools_df['Female']

# Replace a column with its absolute values converted to percent
schools_df['Limited English Proficiency'] = schools_df['Limited English Proficiency'] / schools_df['total'] * 100
Simple column methods (5m12s)
Sorting examples:
# Ascending sort (smallest to largest):
schools_df.sort_values(by=['Limited English Proficiency'])

# Descending sort (largest to smallest):
schools_df.sort_values(by=['Limited English Proficiency'], ascending=False)
Summary of axes terminology:
Simple statistical methods:
.sum() calculate the sum of rows or columns
.mean() calculate the average of rows or columns
.std() calculate the standard deviation of rows or columns
To specify whether to calculate the sum of the row values or the column values, use an axis=rows or axis=columns argument. Alternatively, the axis number can be used: axis=0 .
Dropping and transposing (1m39s)
.drop() method examples:
# drop a single row
state_co2_sector.drop('Total')

# drop a list of rows
state_co2_sector.drop(['Virginia', 'West Virginia', 'Wyoming'])

# drop a column
state_co2_sector.drop('Total', axis='columns')
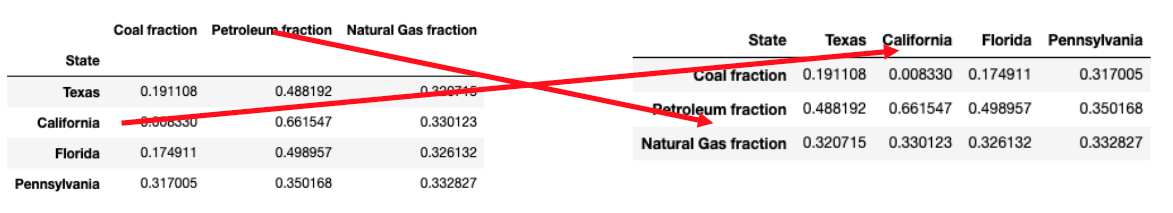
To switch rows and columns, use the .transpose() method. As a shortcut, you can also use .T to transpose rows and columns.
state_co2_sector.transpose()
Combining DataFrames (4m45s)
Concatenating two DataFrames
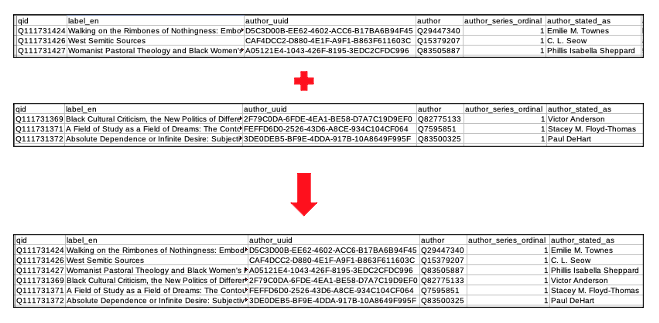
To stack one DataFrame on top of another having the same column labels, use the .concat() method. The argument of the method is a list of the DataFrames to concatenate.
authors = pd.concat([authors1, authors2])
Joining two DataFrames
To join two DataFrames by matching a values from a column in each, use the .merge() method.
Specify the columns to be used in the matching with a left_on and right_on arguments. The value of the arguments is a list of columns.
To only include rows that have matching values (an inner join), use the how=inner argument.
state_data_inner = pd.merge(state_populations_2020, state_co2_sector, left_on=['NAME'], right_on=['State'], how='inner')
To include all rows and fill non-matching rows with missing data (NaN) values, use the how=outer argument.
state_data_outer = pd.merge(state_populations_2020, state_co2_sector, left_on=['NAME'], right_on=['State'], how='outer')
Example workflow (3m12s)
Example script:
url = 'https://github.com/HeardLibrary/digital-scholarship/raw/master/data/codegraf/co2_state_2016_sector_nototals.xlsx'
state_co2_sector = pd.read_excel(url)
state_co2_sector = state_co2_sector.set_index('State')
state_co2_sector['total'] = state_co2_sector.sum(axis='columns')
url = 'https://github.com/HeardLibrary/digital-scholarship/raw/master/data/codegraf/population_by_state_2020.csv'
state_populations_2020 = pd.read_csv(url)
# The label index can be used as an "on" column
state_data_inner = pd.merge(state_populations_2020, state_co2_sector, left_on=['NAME'], right_on=['State'], how='inner')
state_data_inner['per_capita'] = state_data_inner['total'] * 1000000 / state_data_inner['POP_2020']
state_data_inner = state_data_inner.set_index('NAME')
state_data_inner.sort_values('per_capita', ascending=False)
state_data_inner.to_excel('state_data.xlsx')
Practice exercises
You can perform these exercises using your own spreadsheet. For best results, having one that has some string and some numeric columns would be best. If you don’t have something handy to use, you can use this one. It is NOAA weather data from the Global Summary of the Month for Mesa, Arizona. The key to column header abbreviations is here
To practice using this spreadsheet, download it to your local computer by clicking on this link. On most browsers, that should cause it to be downloaded to the normal place where files download on your computer (usually your Downloads directory).
If you are using a local installation of Jupyter notebooks, move it to the folder where you put this week’s practice notebook. If you are using Colab, upload it to the root directory of your Google Drive.
1. Load your Excel spreadsheet as a Pandas DataFrame. There is a “starter” cell at the end of the practice notebook. NOTE: the process will be different depending on whether you are loading the spreadsheet from your local computer file system (local Jupyter notebook install) or from your Google Drive (Colab notbook). If you are using Colab, be sure that you follow the instructions on the Loading a data file in Google Colab video to mount your Google Drive first. Otherwise, you will get an error message. Use the .head() method to display the first lines of the DataFrame.
2. Use the .shape method to find out how many rows and columns there are in the DataFrame.
3. Use the .tail() method to view the end of the DataFrame.
4. The .read_excel() method defaults to assigning a numeric row label index. Examine your data to see if there is a column that has unique values that could be used as a better row label index. A unique identifier for the row would be the best. If your data has such a column, set it as the row index. Don’t forget to assign the output back to the same DataFrame name (or use .copy() if you want to give it a different name).
5. Delete some of the columns that don’t seem useful at the moment. It might be good to assign a copy of the output to a new DataFrame so that you can still access the original.
6. Sort the DataFrame by one of the columns. Make the sort either ascending or descending depending on what makes the most sense. NOTE: if the column contains strings, you will be alphabetizing. If it contains numbers, it will be a numeric sort.
7. Create a new column by performing a calculation on one or more of the other columns.
8. Extract the data from one of the rows using .loc() and display the resulting series.
Next lesson: Extracting and changing values in a DataFrame
Revised 2022-11-08

Questions? Contact us
License: CC BY 4.0.
Credit: "Vanderbilt Libraries Digital Lab - www.library.vanderbilt.edu"