Previous lesson: Extracting and changing DataFrame data
Summarizing and rearranging DataFrames
Preparing data for analysis and visualization can involve cleaning, reformatting, summarizing, and changing the organization of the data. This data-wranging lessons introduces ways to summarize and rearrange data to “wrangle” your data into a usable form.
Learning objectives At the end of this lesson, the learner will:
- use grouping to view a subset of a dataframe using
.groupby()and.get_group(). - generate summary data using
.sum()or.mean()with or without.groupby(). - transform a series having a grouping variable index label to a “wide” DataFrame using
.unstack(). - change a “wide” DataFrame to a “long” DataFrame using the
melt()function. - change a “long” DataFrame to a “wide” DataFrame using the
.pivot()method.
Total video time: 17m 34s
Links
Lesson Jupyter notebook at GitHub
Rearranging data
Grouping and group operations (5m13s)
Grouping is used to group rows that have a common label index. Groups can then be used to collapse the table by summarizing grouped rows using a method like .sum(), .mean(), etc.
Examples:
# Group by a column, then view one of the grouping values:
co2_state_grouped = state_co2.groupby(['State'])
co2_state_grouped.get_group(('Texas'))

# Group by a column, then create a collapsed view by summing the values by group:
co2_sector_grouped = state_co2.groupby(['Sector'])
total_co2_sector = co2_sector_grouped.sum()
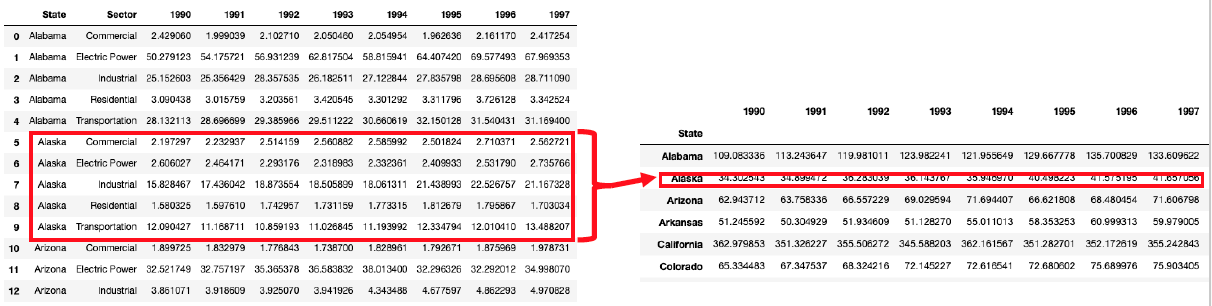
Unstacking long data frames (6m15s)
Example of summing rows, then unstacking to form a “wide” DataFrame:
# Load the data
url = 'https://github.com/HeardLibrary/digital-scholarship/raw/master/data/codegraf/co2_data.xlsx'
state_co2 = pd.read_excel(url)

# Change two generic columns to row index labels
double_label = state_co2.copy().set_index(['Sector', 'State'])

# Collapse the remaining columns by summing their values
year_total = double_label.sum(axis='columns')

# Generate the "wide" DataFrame by unstacking the values and creating columns based on the Sector value
column_df = year_total.unstack('Sector')
Switching between long and wide table forms (6m06s)
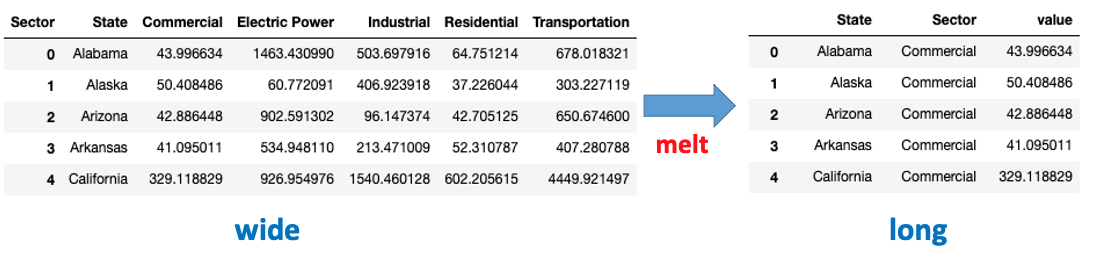
Example of changing a “wide” DataFrame to a “long” DataFrame using the melt() function:
long = pd.melt(wide, ['State'])
Notes:
- The DataFrame name is the first argument
- The columns to remaing as grouping variables (not data) are specified as a list in the second argument.
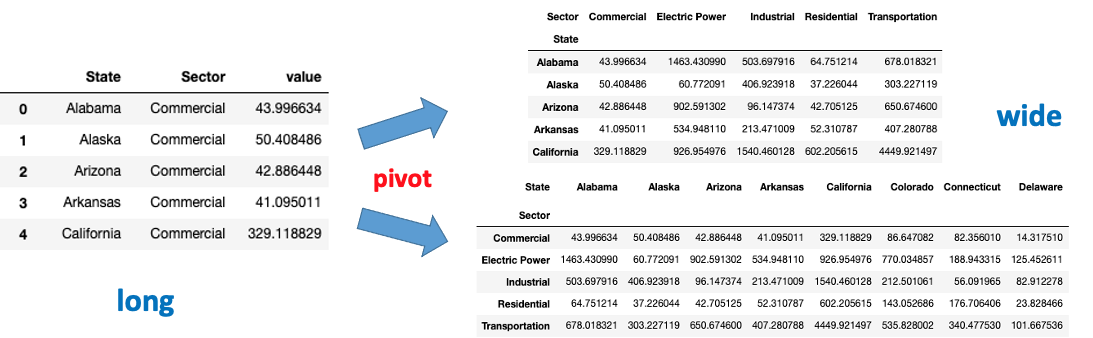
Example of changing a “long” DataFrame to a “wide” DataFrame using the .pivot() method:
state_wide = long.pivot('State', 'Sector', 'value')
Notes:
- The first argument is the name of the column to be used as the row index labels
- The second argument is the name of the column to be used as the column index labels
- The third argument is the name of the column that contains the data that will fill the cells of the new columns.
Next lesson: Introduction to plotting
Revised 2022-11-15

Questions? Contact us
License: CC BY 4.0.
Credit: "Vanderbilt Libraries Digital Lab - www.library.vanderbilt.edu"