return to CircuitPython landing page
Previous lesson: Programming the board (Windows)
Previous lesson: Programming the board (Mac)
Sensors with CircuitPython: Running sensors remotely
This lesson extends the previous two lessons by describing the modifications necessary to operate the QT Py RP2040 under battery power and to store data in its onboard memory.
Learning objectives At the end of this lesson, the learner will be able to:
- explain why the QT Py RP2040 cannot write data to its memory under normal operation.
- use
try...except...clauses to prevent a Python script from terminating when an error is thrown. - draw a sketch showing how a switch and pull-up resistor can be used to change the voltage of an input pin from high to low.
- state how Boolean True and False states are related to voltages in a logic circuit.
- state what is special about the
boot.pyfile in CircuitPython.
Total video time: 7 min 42 s
Links
DiSC CircuitPython code and plotting notebook on GitHub
Writing to the QT Py RP2040 memory
When operating the QT Py RP2040 microcontroller connected to a laptop, the primary use of the onboard memory is to store the Python programs that control interactions with the sensors. However, this board has a relatively large amount of onboard memory, which means that the memory can also be useful for storing data from sensors into files for later retrieval.
CircuitPython memory limitations (3m45s)
Because of the simplicity of CircuitPython, the memory can only be accessed by one device at a time: either from the laptop through the USB, or from the RP2040 microcontroller chip through internal connections on the board.
Trying to write to the memory from a Python script when in read-only mode will result in an error condition. So our code.py script should be able to handle that error gracefully, particularly since that script will automatically run when the board is powered up.
.
try ... except ... example:
number_string = input('Enter a number: ')
number = int(number_string)
try:
    print(10/number)
except:
    print('Division by zero is undefined.')
Read-only error trapping code:
try:
    # use "w" to clear previous data and "a" to append new data to the end of the file
    with open("/temperature.txt", "w") as file_object:
        for count in range(10):
            print("Temp: %.2f C" % hts.temperature)
            temp = hts.temperature
            file_object.write(str(temp) + '\n') # must convert numbers to strings if using the write method
            file_object.flush() # writes the file buffer to the file after each datum is written to the buffer.
            time.sleep(delay_time)
except OSError as e:
    if e.args[0] == 30:
        print('read-only error')
    else:
        print('error', e.args[0])
Controlling the read/write mode of memory (3m58s)
The read or write state of the onboard memory of the QT Py RP2040 can be controlled using an optional script called boot.py that only runs when the board first boots up. It is executed before code.py, so if the read/write state is set to “write” by boot.py, a read-only error can be avoided and the code.py script can write sensor data to the memory.
Unfortunately, the simplest way to control this requires soldering a physical switch between two pins of the board. However, once the switch is installed, you can easily switch between read and write modes of the memory.
.
general reference on writing to a microcontroller filesystem
additional reference on CircuitPython storage
boot.py script to control read/write state:
import board
import digitalio
import storage

switch = digitalio.DigitalInOut(board.D0)
switch.direction = digitalio.Direction.INPUT
switch.pull = digitalio.Pull.UP

# Connecting D0 to ground makes switch.value False
storage.remount("/", switch.value)
Altitude and motion sensors
We will use two sensors to collect flight data during the model rocket launch. The BMP 280 barometer sensor can also be used as an altimeter. The LSM6DS33 9 degrees of freedom inertial measurement unit board contains several sensors on the same board. It contains an accelerometer that can make measurements in the X, Y, and Z directions and a gyroscope that detects rotation in three dimensions. It also contains a magnetometer that we will not be using in this demonstration, but which can be used to determine the sensor’s orientation within the earth’s magnetic field.
Barometer/altimeter
The BMP280 sensor can measure barometric pressure and temperature. Because pressure varies systematically with altitude, this sensor can also determine altitude.
To calculate the altitude, the local pressure (estimated for sea level) must be set using the sensor.sea_level_pressure attribute. The sensor will then be able to calcluate and estimate the altitude in meters. (For changes in altitude, this value is less important.)
For more information about the sensor, see the Adafruit Learn page for the sensor.
The following script will read and display the temperature and pressure, and display the calculated altitude on the serial REPL.
import time
delay_time = 1 # time to delay between multiple measurements

# Set up "board" (QT Py 2040)
import board
import busio # contains an interface for using hardware-driven I2C communication from your board

i2c = busio.I2C(board.SCL1, board.SDA1)

# pressure sensor board
import adafruit_bmp280
sensor = adafruit_bmp280.Adafruit_BMP280_I2C(i2c)

sensor.sea_level_pressure = 1011.1757554

# if True: # uncomment to capture one measurement
# while True: # uncomment for infinite loop
for count in range(10): # uncomment for 10 measurements
    print('Temp: {} C'.format(sensor.temperature))
    print('Pres: {} hPa'.format(sensor.pressure))
    print('Alt: {} m'.format(sensor.altitude))
    print()
    time.sleep(delay_time)
9 DOF accelerometer/gyroscope/magnetometer
The LIS3MDL+LSM6DS33 sensor is actually two sensor chips on a single board. The LIS3MDL measures magnetic fields in the X, Y, and Z direction and can therefore be used to determine the orientation of the sensor relative to the cardinal directions. However, for the model rocket use case, this information is of limited value, so we will be ignoring this sensor. The LSM6DS33 is a “6 degree of freedom” inertial measurment unit, meaning that it can detect both rotation and acceleration in the X, Y, and Z directions for both quantities. This information will be very useful for detecting the change in orientation of the rocket and also its motion based on how it is accelerating.
For more information on the LSM6DS33 sensor see it’s Adafruit Learn page.
The following script will read the acceleration and rotation in each of the three dimensions and display the result on the serial REPL.
import time
delay_time = 1 # time to delay between multiple measurements

# Set up "board" (QT Py RP2040)
import board
import busio # contains an interface for using hardware-driven I2C communication from your board

i2c = busio.I2C(board.SCL1, board.SDA1)

# LSM6DS33 6 DOF sensor board
from adafruit_lsm6ds.lsm6ds33 import LSM6DS33
from adafruit_lsm6ds import Rate, AccelRange, GyroRange
sensor = LSM6DS33(i2c)

# See https://github.com/adafruit/Adafruit_CircuitPython_LSM6DS/blob/main/adafruit_lsm6ds/__init__.py for possible values

sensor.accelerometer_range = AccelRange.RANGE_4G # allowed values are 2G, 4G, 8G, and 16G
print("Accelerometer range set to: %d G" % AccelRange.string[sensor.accelerometer_range])

sensor.gyro_range = GyroRange.RANGE_1000_DPS # allowed values are 125, 250, 500, 1000, 2000
print("Gyro range set to: %d DPS" % GyroRange.string[sensor.gyro_range])

# sensor.accelerometer_data_rate = Rate.RATE_1_66K_HZ
# sensor.accelerometer_data_rate = Rate.RATE_12_5_HZ
print("Accelerometer rate set to: %d HZ" % Rate.string[sensor.accelerometer_data_rate])

# sensor.gyro_data_rate = Rate.RATE_1_66K_HZ
print("Gyro rate set to: %d HZ" % Rate.string[sensor.gyro_data_rate])

print()

if True: # uncomment to capture one measurement
# while True: # uncomment for infinite loop
# for count in range(10): # uncomment for 10 measurements
    xa = sensor.acceleration[0]
    ya = sensor.acceleration[1]
    za = sensor.acceleration[2]

    xg = sensor.gyro[0] - 0.058
    yg = sensor.gyro[1] + 0.161
    zg = sensor.gyro[2] + 0.053

    print( xa, ya, za, xg, yg, zg)
    time.sleep(delay_time)
Note that the first part of the script after the import statements sets the values for sensitivity range and data collection rate. If all of the settings statements are commented out, the defaults will be used and displayed. You probably won’t need to adjust the collection rate values, but the sensitivity ranges may need to be set to be less sensitive if the object will spin rapidly or accelerate at high rates.
The units of the acceleration values are m/s^2 and the units of rotation are radians per second. Note that the rotation values have been adjusted by taking many measurements while the sensor was not rotating, then adding or subtracting an offset so that the rotation readings will be near zero when motionless.
Because the sensor is always experiencing the acceleration of gravity in the downward direction, the sensor will report an acceleration of about 9.8 m/s^2 in whatever axis is pointing down while the sensor is motionless. If the sensor is actually moving, the gravitational acceleration vector must be subtracted to calculate the actual acceleration that is resulting from movement.
Accelerometer/gyroscope test using a ceiling fan
The following video shows a test of the sensor being rotated on the blade of a ceiling fan.
.
The data collected can be viewed here. The sensor was oriented with the sensor pointing downward, so the acceleration of gravity produced a nearly constant Z value of -9.8 m/s^2 . The positive Y axis was pointed outward along the blade, so as the fan began to rotate, you can see the Y value increase from near zero to a relatively constant value of 25 m/s^2 (about 2.5 G’s; this is why the acceleration range for the sensor needed to be changed to 4G).
The rotation of the sensor was almost entirely around the Z axis and we can see this as the rotation increased from near zero to a nearly constant rate of 6.7 radians/s . To convert to revolutions per second, note that there are 2*pi radians per 360 degrees. So the rotation speed was a little over 2 rotations per second, a value that agreed closely with a value derived by timing 100 rotations of the fan blades.
Launching the sensors in a rocket
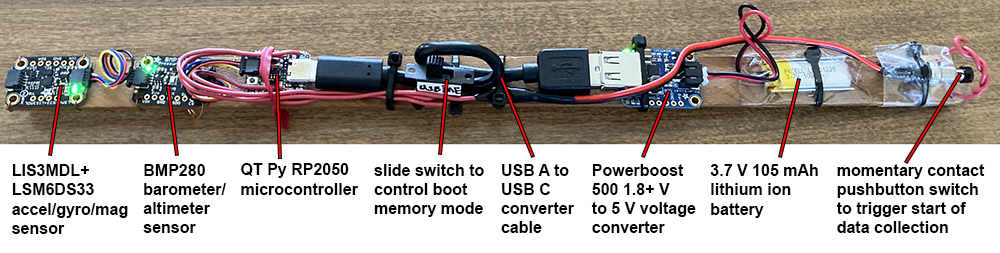
To launch the altimeter and motion sensors in a model rocket, the QT Py 2040 was soldered to two external switches, powered by a small lithium ion battery, and connected to the altimeter and accelerometer/gyroscope sensors. An SPDT slide switch was soldered to the A0/D0 pin on the QT Py to control whether the board would boot in read only or write mode as described above. A momentary contact pushbutton switch was soldered between the ground pin and the A2/D2 pin on the board. This button is used to delay the start of data collection as described here, except that triggering was done using board.D2 instead of the built-in board.button BOOT button on the board. (Any of the digital inputs D1 through D3 could have been used; D2 was chosen for ease of soldering.)
The components were wired or cable-tied to a long, narrow piece of wood so that they would fit into the payload section of the rocket. The accelerometer was positioned so that it would be near the center of gravity of the rocket and with the positive Y axis aligned with the axis of the rocket and the positive direction towards the nose.
Flight simulation
To determine a suitable engine to use based on the constraints of launching in an urban area, the OpenRocket simulation software was used to build a digital model of the rocket and sensor payload.
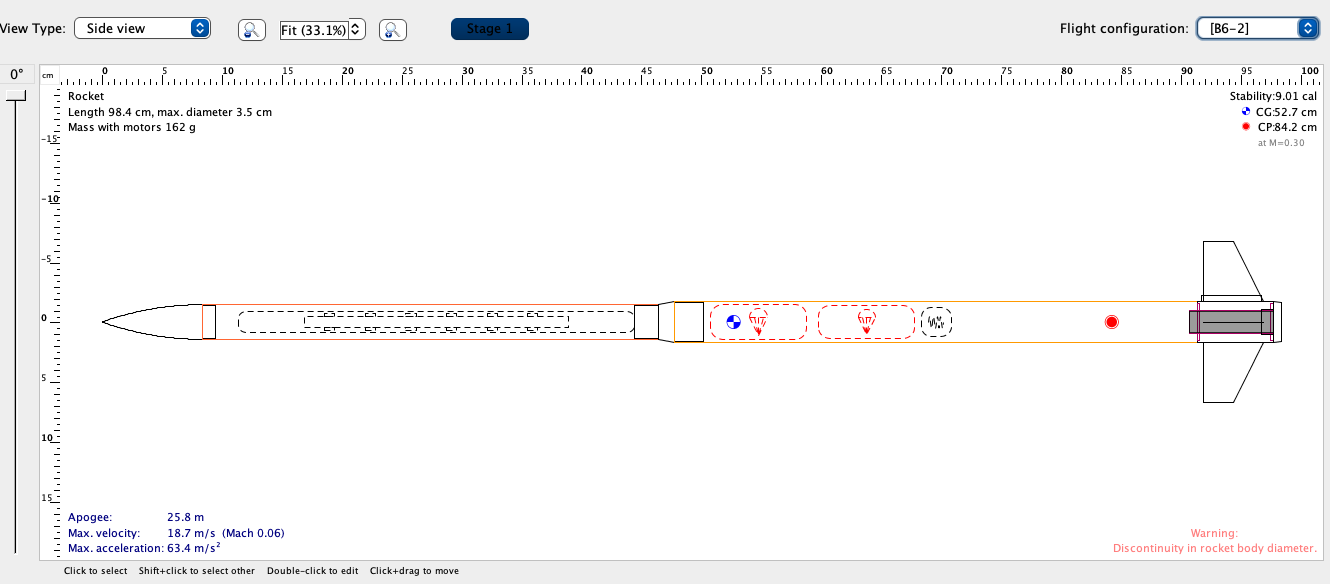
To avoid losing the rocket in a tree or on a building, we wanted to use a low powered engine. The simulation indicated that a B6-2 engine would result in an altitude of about 25 meters with parachute deployment near the apogee of the flight. To avoid excessive weathercocking with a crosswind, the launch rod was extended to 1.3 m so that a higher velocity would be achieved before this relatively heavy rocket came off the launch rod.
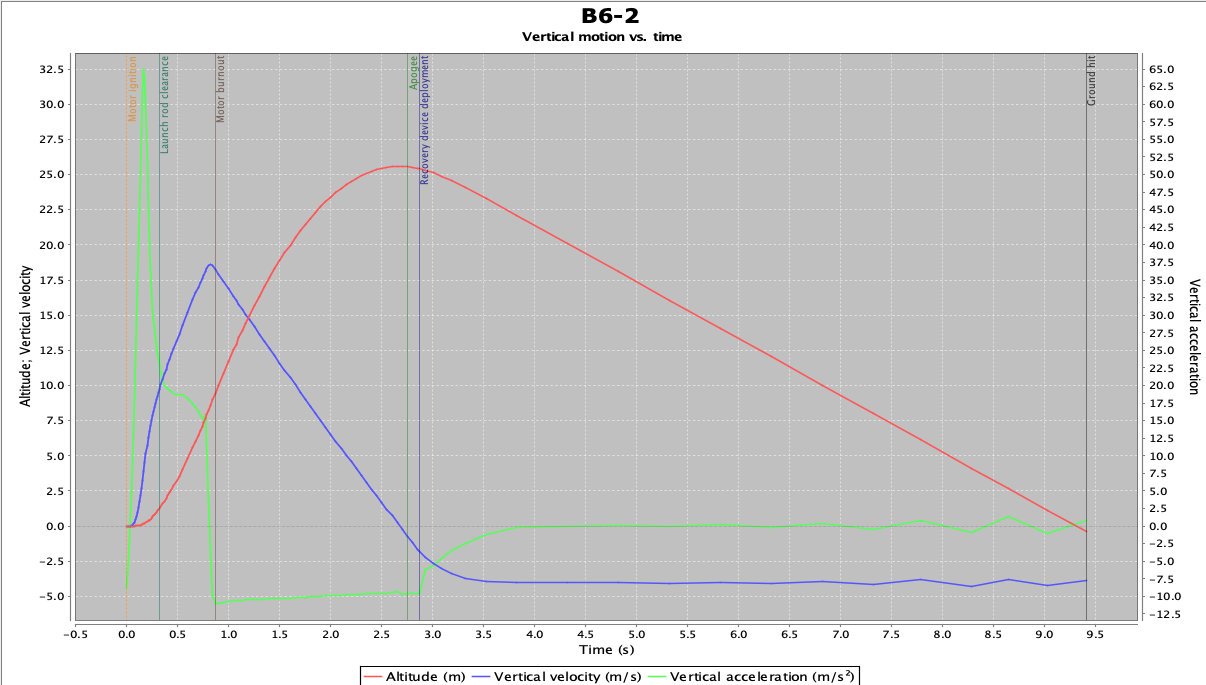
The simulation also indicated that we could expect a maximum acceleration during powered flight of about 32 m/s^2 (about 3.2 G). When added to the acceleration of gravity being experienced by the accelerometer (3.2 G + 1 G), this indicated that we should be operating the accelerometer in the 8G sensitivity range to avoid having the sensor max out.
Script to record and store data
The following script will record data for the time set as a value of seconds_to_run and save it to the onboard memory. This assumes that the boot.py script described above is saved on the board and that a switch has been soldered between the ground and A0 terminals as described above, and that the pushbutton switch was soldered between the ground and A2 terminals.
The data are written into a file called motion.csv that is saved in the root of the QT Py RP2040’s memory. The data is recorded as fast as possible, with an empirically determined rate of about 13 measurements per second. For slower measurements, you can uncomment and adjust the value of delay_time.
As always, the script will execute when the board is reset, but it will not start collecting data until the push button is pressed. The script will only collect and save data if the slide switch is grounding the A0/D0 pin (producing a logical False condition for switch.value). Otherwise, it traps and reports a read-only error.
To operate the system, the board is powered up with the switch set to read-only (open). Operation of the script can then be tested by pressing the pushbotton after a few seconds. The neopixel LED on the QT Py should blink red three times to indicate that data collection was triggered. Following the handling of the read-only error, the LED should immediately blink blue three times to indicate that the script was terminating. The slide switch is slid to the write position and the board’s reset (RST) button should then be pressed to do a hard re-boot and restart the script. To avoid accidentially erasing the data after collection, the switch should be slid back to the read-only position (it will have no effect until the board is reset again).
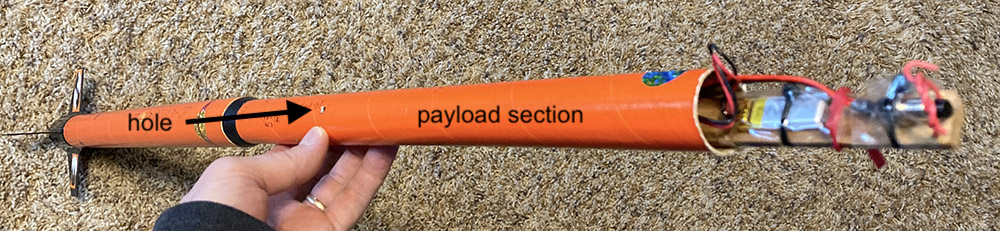
The component assembly is slid into the rocket’s payload section so that the QT Py neopixel LED is oriented towards a small hole cut in the side of the rocket. The rocket is prepped for flight and when everything is ready, the data collection button is pressed while watching through the hole to make sure that the LED flashed red three times. The rocket nosecone is then put into place. The launch needs to take place within the next 1.5 minutes since the script is only set up to collect data for 120 seconds. (The rocket flight should take only about 10 seconds.)
Following the flight, remove the components payload, check that the switch is set to read-only, and disconnect the USB. Connect the QT Py RP2040 to a laptop by USB and copy the motion.csv file to the laptop’s hard drive. The sensor system can then be powered down and the battery disconnected from the voltage converter.
import time
# Estimated time of flight, including recovery is less than 10 s with a B engine.
seconds_to_run = 120
measurements_per_second = 12.6 # determined emprically when running full speed, not imposed by sleep statement
#delay_time = 1/ measurements_per_second # time to delay between multiple measurements

# Set up "board" (QT Py RP2040)
import board
import busio # contains an interface for using hardware-driven I2C communication from your board

i2c = busio.I2C(board.SCL1, board.SDA1)

# Import library to flash LED
import neopixel
pixels = neopixel.NeoPixel(board.NEOPIXEL, 1)

# Code to use the built-in boot button on the board. Pressed is False (grounded)
import digitalio
#button = digitalio.DigitalInOut(board.BUTTON)
button = digitalio.DigitalInOut(board.D2)
button.switch_to_input(pull=digitalio.Pull.UP)

# LSM6DS33 6 DOF sensor board
from adafruit_lsm6ds.lsm6ds33 import LSM6DS33
from adafruit_lsm6ds import Rate, AccelRange, GyroRange
acc_gyro_sensor = LSM6DS33(i2c)

# barometric pressure sensor board
import adafruit_bmp280
bar_sensor = adafruit_bmp280.Adafruit_BMP280_I2C(i2c)

# Set the local air pressure, adjusted for sea level, in hectoPascals
# This value isn't very important in this case where it's the relative altitude that we care about.
bar_sensor.sea_level_pressure = 1011.1757554
print('Sea level air pressure set to:', bar_sensor.sea_level_pressure/10, 'kPa')

# See https://github.com/adafruit/Adafruit_CircuitPython_LSM6DS/blob/main/adafruit_lsm6ds/__init__.py for possible values

# Note: maximum accleration rates for B engines with our rocket estimated around 35 m/s^2.
# With gravity producing acceleration in the opposite direction, the sensor could read up to 45 m/s^2.
# So the range needs to be 8G to measure the peak reading.
acc_gyro_sensor.accelerometer_range = AccelRange.RANGE_8G # allowed values are 2G, 4G, 8G, and 16G
print("Accelerometer range set to: %d G" % AccelRange.string[acc_gyro_sensor.accelerometer_range])

acc_gyro_sensor.gyro_range = GyroRange.RANGE_500_DPS
print("Gyro range set to: %d DPS" % GyroRange.string[acc_gyro_sensor.gyro_range])

# acc_gyro_sensor.accelerometer_data_rate = Rate.RATE_1_66K_HZ
# acc_gyro_sensor.accelerometer_data_rate = Rate.RATE_12_5_HZ
print("Accelerometer rate set to: %d HZ" % Rate.string[acc_gyro_sensor.accelerometer_data_rate])

# acc_gyro_sensor.gyro_data_rate = Rate.RATE_1_66K_HZ
print("Gyro rate set to: %d HZ" % Rate.string[acc_gyro_sensor.gyro_data_rate])

print()

# Program will do nothing until the button is pressed.
print('Press button to start data collection.')
while button.value: # button.value will be True when not pressed
    pass

# Flash LED three times red so we know something happened
for flash in range(3):
    pixels.fill((255, 0, 0))
    time.sleep(0.1)
    pixels.fill((0, 0, 0))
    time.sleep(0.1)

try:
    start_time = time.monotonic_ns()
    with open("/motion.csv", "w") as file_object: # use "w" to clear previous data and "a" to append new data to the end of the file
        file_object.write('seconds,alt,x_acc,y_acc,z_acc,x_gyro,y_gyro,z_gyro\n')
        #file_object.flush()
        for count in range(seconds_to_run * measurements_per_second):
            elapsed_time = (time.monotonic_ns() - start_time)/1000000000
            if count % 100 == 0:
                print(elapsed_time, 's')

            alt = bar_sensor.altitude

            xa = acc_gyro_sensor.acceleration[0]
            ya = acc_gyro_sensor.acceleration[1]
            za = acc_gyro_sensor.acceleration[2]

            xg = acc_gyro_sensor.gyro[0] - 0.058
            yg = acc_gyro_sensor.gyro[1] + 0.161
            zg = acc_gyro_sensor.gyro[2] + 0.053

            file_object.write(str(elapsed_time) + ',' + str(alt) + ',' + str(xa) + ',' + str(ya) + ',' + str(za) + ',' + str(xg) + ',' + str(yg) + ',' + str(zg) + '\n') # must convert numbers to strings if using the write method
            #file_object.flush() # writes the file buffer to the file after each datum is written to the buffer. Not necessary if the file closes
            #time.sleep(delay_time)
except OSError as e:
    if e.args[0] == 30:
        print('read-only error')
    else:
        print('error', e.args[0])

# Flash LED three times blue so we know it's done
for flash in range(3):
    pixels.fill((0, 0, 255))
    time.sleep(0.1)
    pixels.fill((0, 0, 0))
    time.sleep(0.1)

print('done')
Flight data and analysis
The following videos were taken at the workshop rocket launch. The flight data overlaid on the slow-motion videos is discussed below.
Rocket launch at full speed.
0.1x slo-mo with altitude and acceleration components plot overlay
0.1x slo-mo with net acceleration and rotation plot overlay
Flight data visualization:
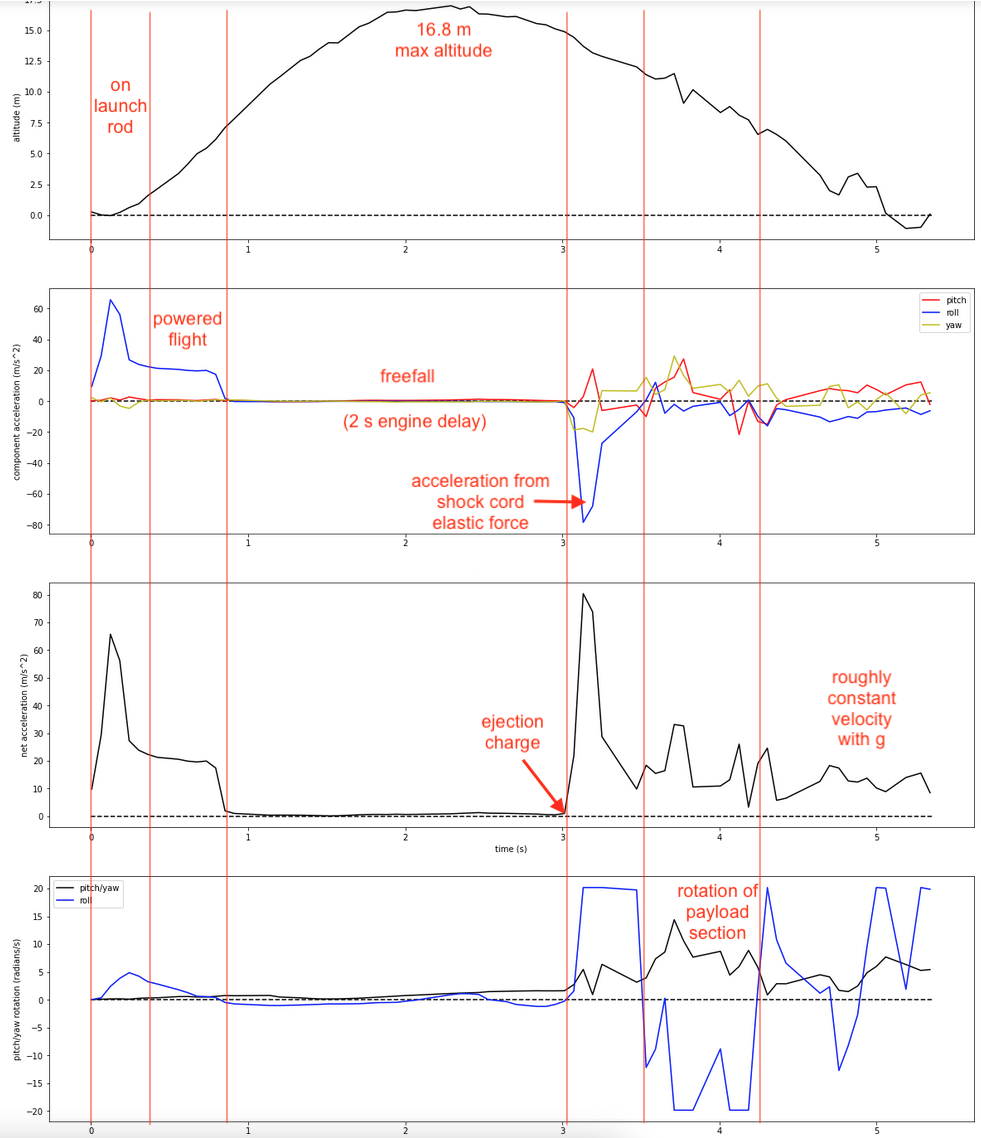
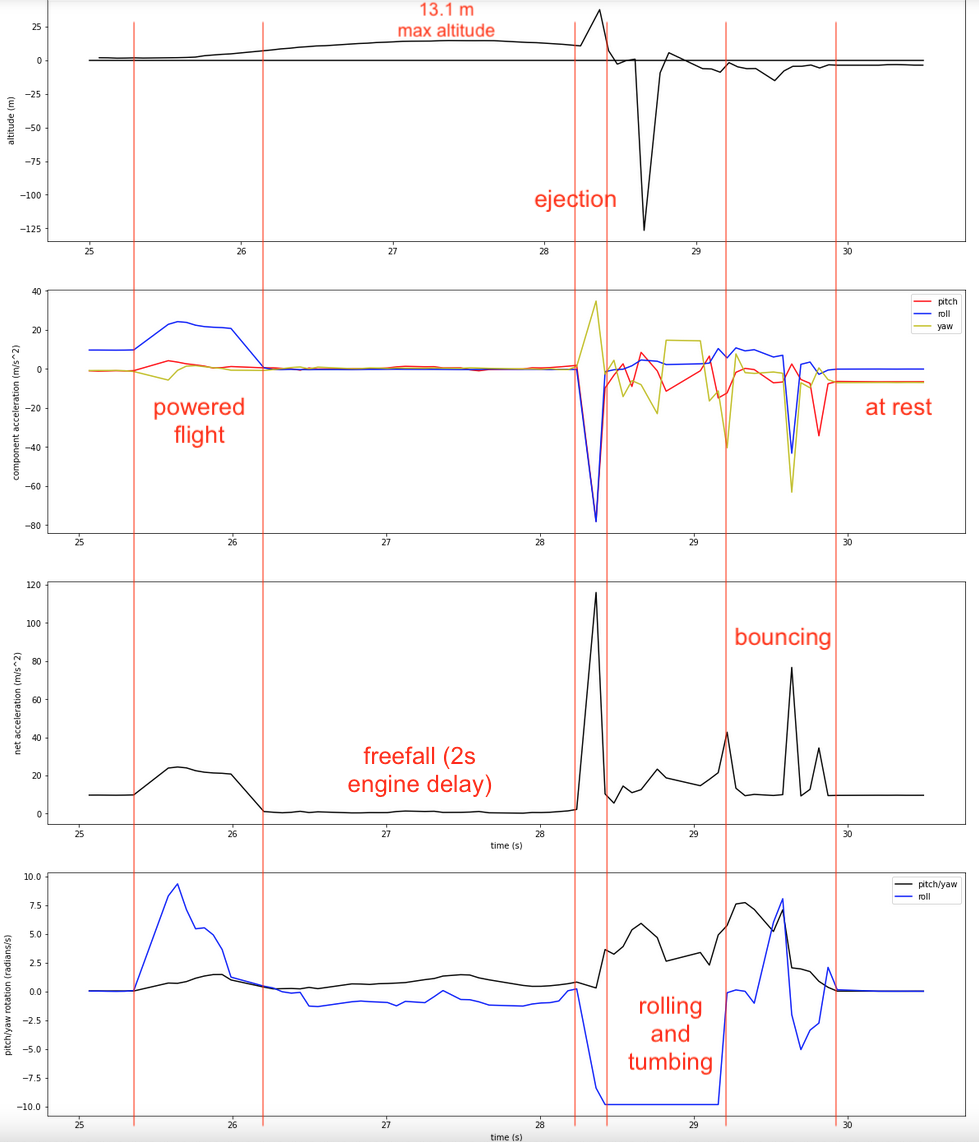
A Jupyter notebook is available to plot the data stored in the motion.csv file. The data collected during the workshop rocket launch displayed above is here and the data collected during a test launch (where the sensors flew out of the end of the payload section!) is here with the visualization of test flight data here.
Run the first cell to find the time interval during which the flight data were collected. Then set the starting and ending times in the second cell to extract and plot the parts of the data for the flight.
Revised 2022-04-18

Questions? Contact us
License: CC BY 4.0.
Credit: "Vanderbilt Libraries Digital Lab - www.library.vanderbilt.edu"